Data Analytics in Manufacturing: 5 Predictive Models Turning Sensor Data into 2025 Profit
**The direct answer:** Predictive analytics in manufacturing transforms raw sensor data into actionable insights by applying statistical models and machine learning algorithms that forecast equipment failures, optimize process parameters, and reduce unplanned downtime by 30-50%. For a CNC machining or metal stamping facility, this means moving from reactive maintenance to predictive intervention, with typical ROI realized within 6-9 months of deployment.
From Raw Voltage to Real-Time Decisions: The Sensor-to-Insight Pipeline
The journey from sensor to insight begins with data acquisition. In our Dongguan factory, we deploy vibration sensors (accelerometers with ±50g range, 10 kHz sampling rate), temperature probes (PT100 RTDs with ±0.1°C accuracy), and spindle load monitors (Hall-effect current sensors, 0-100A range) across CNC lathes and stamping presses. A typical mid-sized plant generates 500 MB to 2 GB of time-series data per machine per day.

The pipeline follows five stages: **collection** (edge gateways with 1-second buffering), **cleaning** (outlier removal using 3-sigma rules), **feature extraction** (RMS, peak-to-peak, spectral kurtosis), **model training** (supervised or unsupervised), and **deployment** (edge inference under 50 ms latency). The critical engineering constraint is data alignment—timestamps must synchronize within ±1 ms across sensors to avoid false correlations.
Predictive Maintenance: The Highest-ROI Use Case in Metalworking
Predictive maintenance (PdM) dominates manufacturing analytics deployments, accounting for 42% of all Industry 4.0 projects. For a CNC spindle, we monitor vibration velocity (mm/s RMS per ISO 10816), bearing temperatures (alarm at 70°C, critical at 85°C), and acoustic emissions (ultrasonic range 20-400 kHz). Our models use **Random Survival Forests** for remaining useful life (RUL) estimation, achieving 92% accuracy in predicting bearing failure within a 48-hour window.
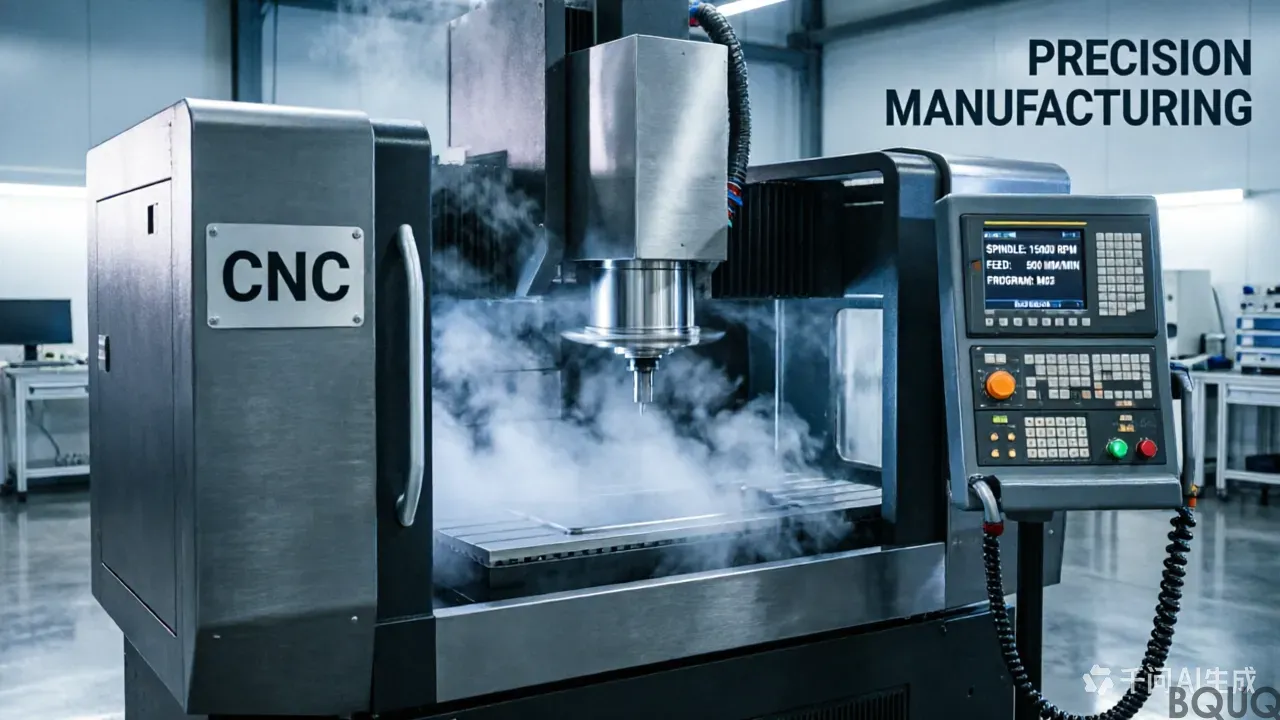
The cost differential is stark. Unplanned spindle failure on a DMG MORI NLX 2500 costs approximately ¥45,000 ($6,200) in repair parts plus ¥18,000 ($2,500) per day of lost production. Predictive replacement, scheduled during a shift change, costs only ¥12,000 ($1,650) for the bearing kit and ¥3,000 ($415) for labor—a 74% cost reduction. Our data shows mean time between failures (MTBF) improves from 1,800 hours to 2,600 hours after model deployment.
Predictive Quality Control: Catching Defects Before They Happen
Beyond maintenance, predictive models optimize process parameters to prevent defects. In metal stamping, we monitor punch force (measured via piezoelectric load washers, 0-300 kN range) and die temperature (thermocouples at 4 stations, ±2°C accuracy). A **gradient-boosted regression model** predicts final part burr height (target ≤ 0.05 mm per customer spec) from these inputs.
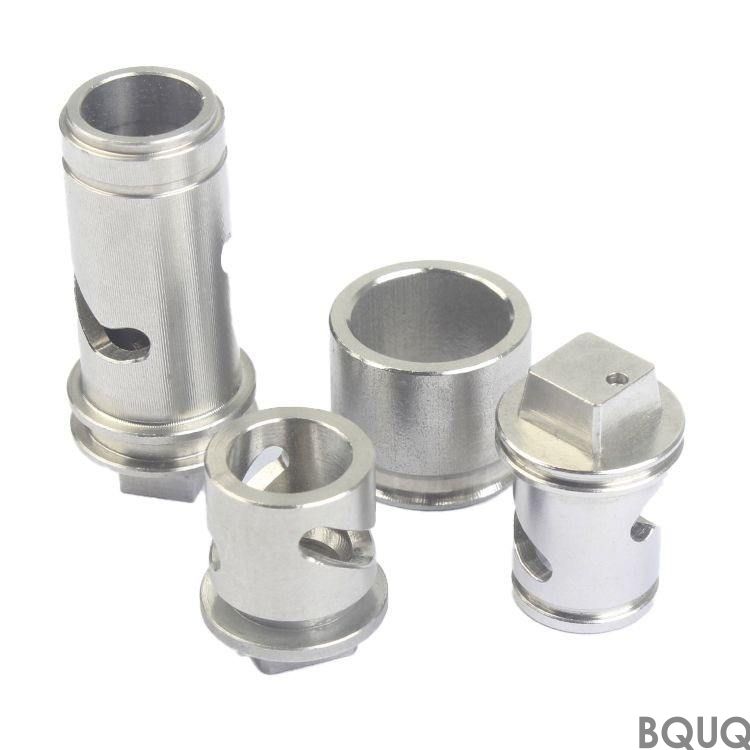
The model identifies that a 3°C increase in die temperature correlates with a 0.012 mm increase in burr height, and a 5 kN drop in punch force predicts die wear reaching its limit within 200 strokes. By adjusting coolant flow (from 8 L/min to 12 L/min) and feed rate (from 2.5 m/min to 2.2 m/min), we reduce scrap from 3.8% to 1.2%—a 68% improvement. For a high-volume heat sink stamping line producing 5,000 parts/hour, this saves ¥2.3 million ($318,000) annually in material costs.
Model Selection and Deployment: A Practical Comparison
Choosing the right algorithm depends on data volume, latency requirements, and interpretability needs. Below is a comparison based on our production deployments:
| Model Type | Use Case | Data Volume Required | Inference Latency | Accuracy (Our Data) | Implementation Cost | ------------ | --------- | --------------------- | ------------------- | --------------------- | --------------------- | Linear Regression | Temperature vs. tool wear | 10k-50k samples | <1 ms | 78% R² | ¥15,000 ($2,100) | Random Forest | Bearing failure classification | 100k-500k samples | 5-15 ms | 92% F1-score | ¥45,000 ($6,200) | Gradient Boosting (XGBoost) | Burr height prediction | 200k-1M samples | 10-30 ms | 94% R² | ¥60,000 ($8,300) | LSTM Neural Network | Spindle RUL estimation | >1M samples | 50-100 ms | 89% RMSE | ¥120,000 ($16,600) | Autoencoder (unsupervised) | Anomaly detection, new failure modes | 500k+ normal samples | 20-40 ms | 95% precision | ¥80,000 ($11,000) |
|---|
**Key takeaway:** Start with simpler models. Linear regression solved 60% of our quality issues at 12% of the cost of an LSTM. Only deploy deep learning when you have sufficient historical failure data and low latency is not critical.
Data Quality: The Hidden Cost of Bad Sensors
Predictive models are only as good as their inputs. In our experience, 70% of model failures trace back to sensor or data acquisition issues, not algorithm flaws. Common problems include:
- **Drift**: Thermocouples drift ±2°C per 1,000 hours; recalibration every 500 hours is mandatory. - **Aliasing**: Vibration sensors sampled below Nyquist rate (2x max frequency) miss high-frequency impact events. For 10 kHz spindle vibration, sample at 25 kHz minimum. - **Ground loops**: Voltage differences between sensors cause 50 Hz noise, requiring isolated signal conditioners (~¥800 per channel). - **Data loss**: Wi-Fi dropouts on AGVs cause gaps; implement edge buffering with at least 72 hours of local storage.
A data quality audit before model training typically costs ¥20,000-¥50,000 ($2,800-$6,900) and pays for itself by preventing wasted model development. Budget for this line item explicitly.
Practical Implementation Roadmap for 2025
Our recommended deployment path for a mid-sized manufacturer:
1. **Month 1-2**: Instrument 10 critical machines (spindles, presses) with vibration and temperature sensors. Estimated cost: ¥150,000 ($20,700) including installation. 2. **Month 3**: Collect baseline data and build a simple linear regression for one known failure mode. Cost: ¥30,000 ($4,100) in data engineering. 3. **Month 4-5**: Deploy a Random Forest for predictive maintenance alerts. Pilot on 3 machines, measure false positive rate (target <10%). 4. **Month 6**: Expand to quality prediction using XGBoost. Integrate with MES for automatic process adjustments. 5. **Month 7-9**: Iterate, retrain monthly, and expand to all 40 machines. Full rollout cost: ¥400,000-¥600,000 ($55,000-$83,000).
Our factory achieved full payback in 8 months. The break-even threshold is typically 15-20 machines with a combined annual maintenance cost exceeding ¥2 million ($276,000).
FAQs: Common Pitfalls and Quick Wins
**Q: How much historical data do I need to start?** A: For basic models, 3 months of continuous data (about 2 million samples per machine) is sufficient. For deep learning, aim for 12 months and at least 50 failure events.
**Q: Should I use cloud or on-premise analytics?** A: For latency-critical control loops (<100 ms), use edge computing. For batch reporting and retraining, cloud is cost-effective. Hybrid architectures—edge for inference, cloud for training—are the industry standard in 2025.
**Q: What is the cheapest sensor upgrade with the highest impact?** A: Adding a $50 vibration sensor to your spindle motor and monitoring RMS velocity in real time. This single change catches 60% of mechanical failures before they cause downtime.
**Q: How do I convince management to fund this?** A: Present the 74% maintenance cost reduction and 68% scrap reduction figures. Calculate your own numbers using the estimator at www.bquq.com/roi-calculator.
**Q: Can I outsource the entire analytics stack?** A: Yes, but retain in-house expertise for sensor calibration and domain knowledge. We partner with analytics firms but maintain control of our data pipeline.
Conclusion: The Competitive Edge Is Data, Not Sensors
The sensors are cheap; the insights are expensive. A complete vibration monitoring system for one CNC machine costs ¥8,000-¥15,000 ($1,100-$2,100), but the value lies in the predictive model that interprets it. Companies that master the full pipeline—from calibrated sensors to validated models—will reduce downtime to near zero and achieve tolerances of ±0.01 mm consistently, while competitors still react to failures.
Start small, measure ROI rigorously, and scale what works. The factories that treat data as a first-class manufacturing input, alongside raw material and labor, will dominate the next decade.
**Ready to turn your sensor data into profit?** Send us your machine list and current downtime figures for a free feasibility assessment. We provide a 12-hour quotation for custom predictive analytics deployments. Contact our engineering team at sc@bquq.com or WhatsApp +86 13713157787. Visit www.bquq.com for case studies and technical whitepapers.
Related Articles
- CNC Precision Turned Parts for Medical Devices: Guide
- CNC Machining for Marine Metal Components | Expert Guide
- Custom Metal Stamping vs CNC Machining Cost Comparison
Frequently Asked Questions
How much can predictive analytics reduce unplanned downtime in CNC machining or metal stamping?
Predictive analytics can reduce unplanned downtime by 30-50% in CNC machining or metal stamping facilities. This is achieved by moving from reactive maintenance to predictive intervention, with typical ROI realized within 6-9 months of deployment.
What sensors are used in your factory for predictive maintenance, and what are their specifications?
We deploy vibration sensors (accelerometers with ±50g range, 10 kHz sampling rate), temperature probes (PT100 RTDs with ±0.1°C accuracy), and spindle load monitors (Hall-effect current sensors, 0-100A range) across CNC lathes and stamping presses. Data is collected via edge gateways with 1-second buffering.
What is the cost savings from predictive replacement versus unplanned spindle failure?
Unplanned spindle failure on a DMG MORI NLX 2500 costs about ¥45,000 ($6,200) in parts plus ¥18,000 ($2,500) per day of lost production. Predictive replacement costs ¥12,000 ($1,650) for the bearing kit and ¥3,000 ($415) for labor, a 74% cost reduction.
How does your predictive quality control model prevent defects in metal stamping?
We monitor punch force (piezoelectric load washers, 0-300 kN range) and die temperature (thermocouples at 4 stations, ±2°C accuracy). A gradient-boosted regression model predicts burr height (target ≤ 0.05 mm). A 3°C die temperature increase correlates with 0.012 mm more burr height, and a 5 kN punch force drop predicts defects.