Total Cost of Sourcing: Beyond the Unit Price
Short answer: The unit price on a Chinese quotation is typically only 45-70% of what a part actually costs you by the time it is bolted into your assembly. The rest hides in freight, duty, incoming inspection, scrap, safety stock, engineering time, and the cost of a late shipment. A workable total cost of sourcing model adds six to nine line items to the quoted price and weights them by your own volumes and defect tolerance. For a mid-volume precision part, a supplier quoting 12% more per piece but holding ±0.005 mm and shipping on a stable lead time usually wins on total cost — often by 8-20% over a year.
Why the unit price is a poor decision variable
Purchasing teams are measured on price variance, so the quoted piece price becomes the default scorecard. That is a structural mistake, not a personal one. The unit price is the only number a supplier can put in a cell on a spreadsheet; every other cost is created downstream by that supplier's process capability, documentation, packaging, and delivery reliability.
Consider two stamping suppliers quoting a 0.4 mm thick connector shell. Supplier A quotes $0.031 per piece, Supplier B quotes $0.036. On 500,000 pieces a year, that is $2,500 in apparent savings for A. Now add A's real profile: 1.8% incoming reject rate, no PPAP-style dimensional report, parts shipped in bulk bags that tangle in the feeder, and a lead time that swings between 22 and 45 days. The reject cost alone — scrapped pieces, rework labour, line stoppage, expedited replacement — routinely exceeds the $2,500 spread. The cheaper quote was never cheaper.
The fix is to define cost the way your finance team defines it: everything that leaves your bank account because you chose this supplier.
The seven cost layers of a sourced part
A total cost of sourcing model does not need to be a 40-tab spreadsheet. It needs to capture the layers where money actually leaks. Most of the leakage sits in layers four through seven, which is exactly where a unit-price comparison is blind.
| Layer | What it includes | Typical share of total cost |
|---|---|---|
| 1. Piece price | Quoted unit cost at agreed volume | 45-70% |
| 2. Tooling & NRE | Moulds, dies, fixtures, first-article reports | 1-8% (amortised) |
| 3. Freight & duty | Sea/air, insurance, tariff, customs brokerage | 3-12% |
| 4. Incoming quality | Inspection labour, gauges, sampling, sorting | 1-6% |
| 5. Defect cost | Scrap, rework, line stop, warranty, field returns | 0-15% |
| 6. Inventory & lead time | Safety stock, WIP, expedite premiums, obsolescence | 2-10% |
| 7. Management overhead | PO admin, chasing, audits, travel, engineering time | 1-5% |
The percentages are indicative ranges observed across mid-volume precision metal parts; your mix will differ. The point is that layers 4-7 are not small, and they are all driven by supplier behaviour rather than by the part drawing.
Why defect cost is the most underestimated layer
A 2% incoming defect rate sounds tolerable until you price it. If a defect escapes to your assembly line, you pay for the operator's time to find it, the downtime while the line is stopped, the rework or scrap of any value already added, and the administrative cost of a deviation. A common rule of thumb in electronics assembly is that a defect caught at the supplier costs 1x, at incoming inspection 10x, and at the customer 100x. Even if those multiples are approximate, the direction is unambiguous: pay for capability upstream instead of inspection downstream.
Why lead time variability costs more than lead time
A stable 30-day lead time is manageable. A lead time that averages 30 days but ranges from 20 to 55 is not, because you must plan against the worst case. That extra 25 days of buffer, multiplied by your annual consumption and carrying cost, is a real annual expense — and it is invisible on any quotation. Suppliers with controlled internal processes (in-house tooling, in-house finishing, one factory rather than three subcontractors) tend to compress that variance, which is worth more than a few percent on price.
How to build the model in practice
You do not need perfect data. You need consistent data. Build the model once, then reuse it for every new RFQ.
Step 1: Normalise the quotation
Ask every supplier for the same cost breakdown structure: piece price at three volume tiers, tooling cost with ownership terms, MOQ, lead time with a stated on-time history, packaging spec, and Incoterm. If a supplier cannot state lead-time variance, that is itself data. Our own supplier vetting checklist covers the questions that expose these gaps before you commit.
Step 2: Assign your own cost rates
Use your real numbers, not industry averages: your loaded labour rate per hour for inspection, your carrying cost of capital, your average cost per line-stop minute, your duty rate for the HS code. These rates convert supplier behaviour into currency.
Step 3: Score defect and delivery risk
Multiply expected defect rate by your cost-per-defect. Multiply lead-time variance by your daily carrying cost. Both are estimates, but they force the conversation away from price alone.
Step 4: Run the comparison at annual volume
A per-piece comparison at 1,000 units is noise. Run it at your annual volume, including tooling amortisation, and re-run it after any supplier process change.
| Cost element | Supplier A (low price) | Supplier B (capable) |
|---|---|---|
| Piece price | $0.031 | $0.036 |
| Annual piece cost (500k) | $15,500 | $18,000 |
| Tooling amortised (year 1) | $1,200 | $1,200 |
| Freight & duty | $1,400 | $1,400 |
| Incoming inspection | $2,600 | $900 |
| Defect & line-stop cost | $6,800 | $1,100 |
| Safety stock carrying cost | $1,900 | $700 |
| Admin & expediting | $1,500 | $600 |
| Annual total | $30,900 | $23,900 |
In this illustrative model, the supplier quoting 16% more per piece is 23% cheaper in total. The swing is driven almost entirely by quality and delivery behaviour, not by the piece price.
Where a single-factory source changes the maths
The cost layers above are not equally controllable by every supplier. A trading company or a supplier that subcontracts finishing, heat treatment, and plating has more handoffs, more lead-time variance, and less ability to contain a defect before it reaches you. Every handoff is a place where cost is added and accountability is diluted.
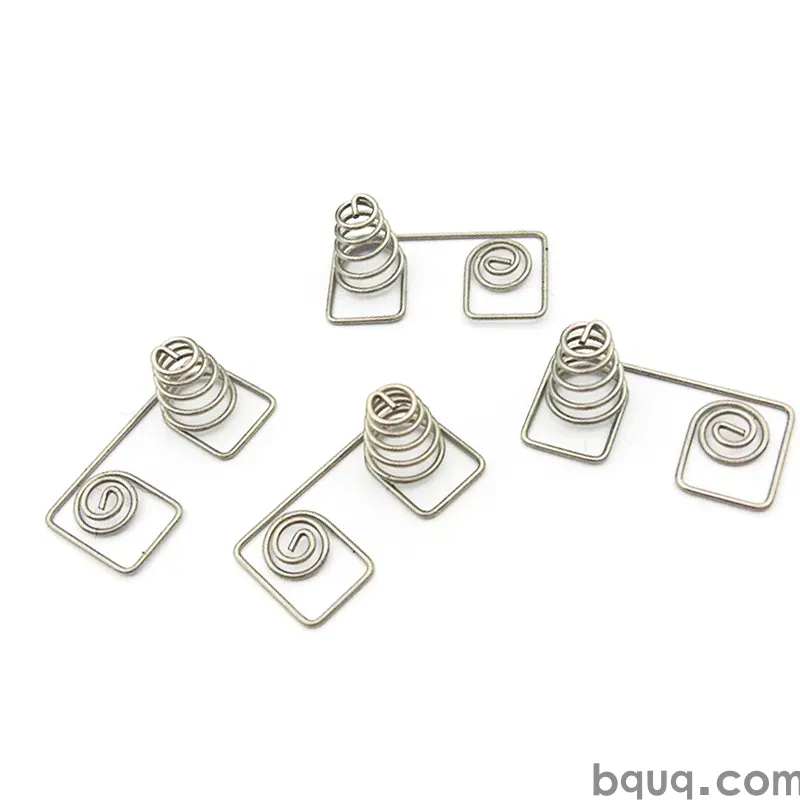
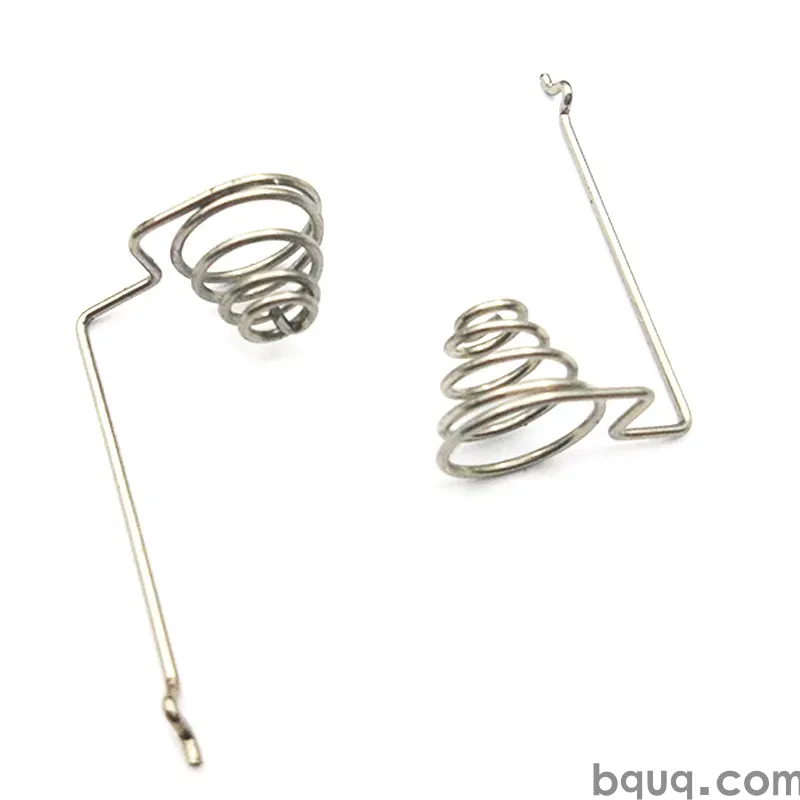
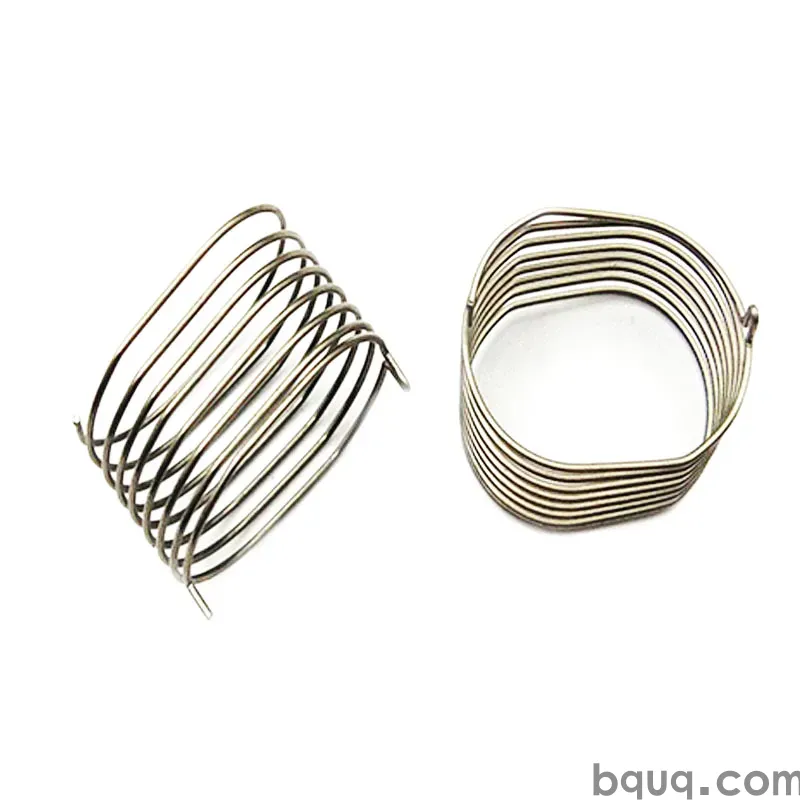
BQUQ runs four production lines in one Dongguan factory covering CNC machining to ±0.005 mm, metal stamping, custom springs including compression springs, and heat sinks. Under ISO9001, dimensional records stay with the part rather than being reconstructed from a subcontractor's email. That structure directly attacks layers 4, 5, and 6 of the cost model: fewer handoffs means fewer escape points, shorter and more stable lead times, and less safety stock. It also means tooling and process questions get answered by the people who run the machines.
If you are still deciding whether to keep a process in-house, the trade-offs are covered in our comparison of in-house versus outsourced manufacturing.
Practical levers that reduce total cost
Buy capability, not inspection
Every dollar spent on incoming inspection is a dollar spent compensating for a supplier's process. Tighten the supplier's process instead. Ask for first-article inspection reports, control plans for critical dimensions, and a stated Cpk on the features that matter. Then reduce sampling.
Fix tooling ownership early
Tooling is a cost layer and a risk layer. If you do not own the tool, you cannot move it, and you cannot competitively re-quote. The commercial and legal details are in our guide to tooling ownership in China.
Consolidate the bill of materials
Sourcing five similar parts from five suppliers multiplies freight, admin, and inspection costs. Consolidating a family of parts — brackets, pins, springs, heat sinks — under one supplier with one shipment and one quality report often removes 3-8% of total cost without touching the piece price.
Match the process to the volume
CNC machining wins on low-to-mid volume and complex geometry; stamping wins above roughly 10,000 pieces per year for a flat part. Choosing the wrong process for the volume is one of the largest hidden cost drivers, because it inflates both piece price and lead time. Our breakdown of CNC versus stamping supplier selection walks through the crossover points.
Reduce lead-time variance deliberately
Ask for a rolling on-time delivery metric. Suppliers who measure it improve it. Suppliers who cannot produce it are telling you something.
Frequently Asked Questions
Q: What is the difference between unit price and total cost of sourcing?
A: Unit price is the quoted cost per piece. Total cost of sourcing adds tooling amortisation, freight and duty, incoming inspection, defect and line-stop cost, inventory carrying cost, and purchasing overhead. For mid-volume precision parts, the quoted price typically represents only 45-70% of the true annual cost, so decisions made on piece price alone frequently destroy value.
Q: How do I estimate defect cost if I have no historical data?
A: Start with your supplier's stated reject rate, then apply your own cost per defect: inspection labour, scrap value, downtime, and rework. If no data exists, run a 500-piece pilot and measure. Even a rough estimate is far more useful than treating defect cost as zero, which is the implicit assumption in every unit-price-only comparison.
Q: Does a higher unit price ever reduce total cost?
A: Yes, routinely. A supplier with tighter process control, in-house finishing, and stable lead times can quote 10-20% more per piece yet deliver 15-25% lower total cost through fewer defects, less inspection, and lower safety stock. The gap widens as your annual volume and assembly complexity increase.
Q: How many volume tiers should I request in an RFQ?
A: Three is usually enough: a pilot quantity, a mid volume, and your expected annual volume. More tiers add work without changing the decision. Ask for tooling cost separately at each tier, and confirm whether the quoted price assumes a single release or scheduled deliveries, since that affects both price and inventory cost.
Q: How does BQUQ support a total cost evaluation?
A: BQUQ quotes in 12 working hours and works with flexible MOQ, so you can run a pilot before committing to annual volume. We provide dimensional reports, tooling ownership terms, and lead-time commitments in writing. Send drawings and annual volumes to sc@bquq.com and we will return a cost breakdown structured for your total cost model.
Related Resources
- About BQUQ and our four Dongguan production lines: /about/
- CNC machining, metal stamping, springs and heat sinks: /cnc-machining/ and /custom-metal-stamping/
- Industry trends affecting sourcing cost: /industry-dynamics/
- Technical articles and engineering guides: /bquq-blog/
- Frequently asked questions: /faq/
- Case studies: /case/
- Contact the engineering team: /contact/
Authored by the BQUQ Engineering Team. BQUQ (Dongguan) runs CNC machining (±0.005 mm), metal stamping, custom springs, and heat sink production in one ISO9001 factory. Source-direct from Dongguan, China — quote in 12 hours: sc@bquq.com | WhatsApp +86 13713157787 | www.bquq.com